Data Analysis

Chemical Screen: Evaluating drug sensitivity

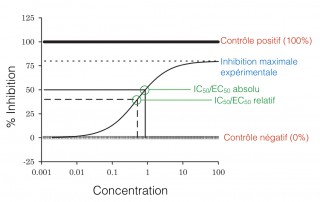
The study of the cellular response to a chemical compound is crucial to the development of new therapeutic drugs. Such an analysis is usually done by a screen experiment where the disease-specific cells (such as leukemia primary cells) are exposed to chemical compound for different concentrations. The response, in the form of sensitivity, of these cells is conventionally quantified by the IC50 or the l’EC50. Here are some notions to keep in mind when we analyze these values.  IC50/EC50 : estimate of [...]

By |2017-04-29T11:08:17+00:00February 13, 2017|Categories: Data Analysis|Tags: |0 Comments

Logistic regression and GTEx

Working with all sorts of data, it happens sometimes that we want to predict the value of a variable which is not numerical. For those cases, a logistic regression is appropriate. It is similar to a linear regression except that it deals with the fact that the dependent variable is categorical. Here is the formula for the linear regression, where we want to estimate the parameters beta (coefficients) that fit best our data : \begin{equation} Y_i = \beta_0 + \beta_1 X_i [...]

By |2017-04-29T17:44:14+00:00January 27, 2017|Categories: Biology, Data Analysis, Python|Tags: , , |0 Comments

A javascript implementation of the non-central version of Fisher’s exact test

In a previous post, I presented a case for choosing a non-central version of Fisher's exact test for most of bioinformatics' uses of this test. I will now present an implementation of this test in javascript that could easily be embedded in web interfaces. Although javascript is probably the least likely language to implement statistical methods, I hope this article will fill in as many details as possible to make it trivial to port it to other languages if the need arises. At [...]

By |2017-04-29T17:47:57+00:00January 13, 2017|Categories: Data Analysis|Tags: , , |0 Comments

Pivoting tables : from long to wide

As bioinformaticians, we often have to work with data that are not formatted the way we would need them to be. One case we might encounter is receiving data in a "long" format instead of receiving them in a more familiar "wide" format. For those of you familiar with the ggplot R package, you know this format very well. It's the format required by ggplot to produce its nice graphs.   Long genes samples expression 1 BAD S01 7.525395 2 [...]

By |2017-04-29T18:11:56+00:00November 14, 2016|Categories: Data Analysis, Python, R|Tags: |0 Comments

Bootstraps and Confidence Intervals

When analyzing data, you might want or need to fit a specific curve to a particular dataset. This type of analysis can result in instructive outputs regarding the relationship between two (or more...) quantifiable parameters. The main object of this post is not how to implement such fitting, but rather how to display the goodness of such a fit i.e. how to calculate a confidence interval around a fitted curve. That being said, I will show how to do curve fitting in [...]

By |2017-04-29T18:33:55+00:00September 29, 2016|Categories: Data Analysis, R, Statistics|Tags: |1 Comment
Go to Top