

I was recently asked by a colleague to provide visualization of differential gene expression computed using RPKM values (two samples, no replicates) and highlight genes that were outside the distribution by 2 standard deviations or more. As a first draft, I quickly obliged by calculating the fold change distribution, computing standard deviation and drawing lines on either side of the diagonal to obtain:
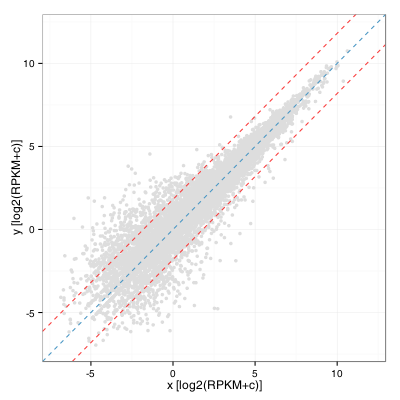
This turns out to be equivalent to computing the standard deviation of the residual of a linear model fitted on this distribution. In R:
sd(residuals(lm(y ~ x + 0)) ~= sd (log(FC))
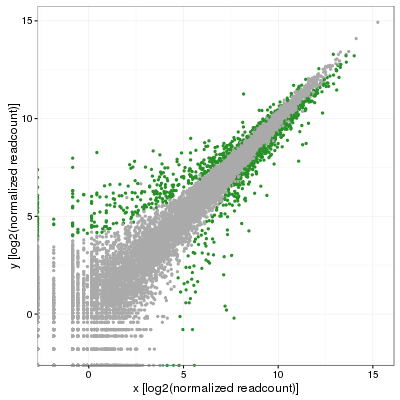
My colleague was quick to point out that this was less than satisfying and that (s)he was expecting the standard deviation to vary along the diagonal. That makes perfect sense although after many minutes of search, no answer was in sight. Eventually, we obtained replicates for this projects and I then performed a full blown differential expression analysis using DESeq2 in which I used the adjusted p-value to color significant genes (p-adj < 0.001):
Fast forward a few weeks later and the answer suddenly appeared out of nowhere in the form of simple geometry and I ended up testing the following. First, fit a linear model on the distribution to obtain the slope (m) of the model, which should incidentally be close to 1 if data is correctly normalized. In my case, I obtained 0.986, not bad at all. Then, rotate the distribution by the angle corresponding to that slope, or atan(m), but clockwise so that Theta=-atan(m). This is simply done by converting each coordinate (x,y) using a rotation matrix:
![]()
We can then compute a windowed standard deviation on the y’ values along the x’ axis and transform back these values as two curves using a rotation of -Theta. This yields:
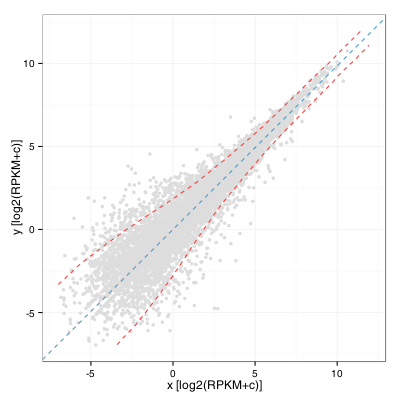
A keen observer will note that this is almost the same as computing a windowed standard deviation curve of the A values of a MA plot along the M axis. It would in fact be the same if the rotation angle was exactly pi/4. Also, the standard deviation threshold alone would probably not be an excellent criteria to identify interesting genes as it would tend to select many lowly expressed ones. A limit on expression level and fold change remains our best option when working without replicates.
could you share the R code for this?
Hi,
This is very helpful for doing pairwise comparisons. Could you please share the R code for this?
Here is the code for the last graph: