

The study of the cellular response to a chemical compound is crucial to the development of new therapeutic drugs. Such an analysis is usually done by a screen experiment where the disease-specific cells (such as leukemia primary cells) are exposed to chemical compound for different concentrations. The response, in the form of sensitivity, of these cells is conventionally quantified by the IC50 or the l’EC50. Here are some notions to keep in mind when we analyze these values.
IC50/EC50 : estimate of the relative value
The IC50 (inhibitory concentration) is the concentration for which the response is half that of the control. As the name implies, this value is applicable when the response analyzed is the inhibitory effect of the compound. Whereas, when the response analyzed is the activity of the molecule, in term of cell growth for example, the the EC50 (effective concentration) is used. This value is therefore the concentration for which the response is half of the maximum response.

Figure 1. Graphical representation of the absolute and relative IC50/EC50. The curve represents the % of inhibition of a chemical compound for different given concentrations: the 50%-response corresponds to the EC50. The positive and negative controls are used to determine the absolute IC50/EC50, while the negative control and the maximum experimental inhibition are used to determine the relative IC50/EC50. (Adapted from Sebaugh)
When the 4-parameter log-logistic model is used to estimate the 50%-response, it should be borne in mind that the value of parameter $c$ is in fact the relative IC50/EC50. Relative since the estimate corresponds to the value halfway between the maximum and minimum responses: the parameter $c$ is therefore greatly dependant on the estimate of the parameters $a$ and $d$.
$$response = \frac {a-d} {1 + 10^{b \cdot {\left( \log_{10} c-{\log_{10} concentration}\right )}}} + d$$
Equation 1. Log-logistic model with four parameters, defining the response in regard to concentration ($log_{10}$). The lower and upper plateaus are defined by $a$ and $d$. The relative IC50/EC50 corresponds to $c$, and the slope of the curve is defined by $b$. The parameters are optimized by a non-linear regression.
In order to work with the absolute value, a second equation must be used, taking as parameters the estimates obtained previously. A second regression is then necessary. The experimental protocol must also be slightly altered, in particular by the addition of controls for a maximum response (positive controls). Sebaug describes the process to follow well.
So, when we are analyzing a dose-response curve for a given compound, it is important to look at the IC50/EC50 in wider context than its value alone. For example, the absence of an obvious upper plateau could indicate an IC50/EC50 greater then the “true” value. Sebaugh states that a minimum of 2 concentrations on each plateau os required to ensure an accurate relative IC50/EC50. The selection of the number and the values of the concentration is therefore crucial.
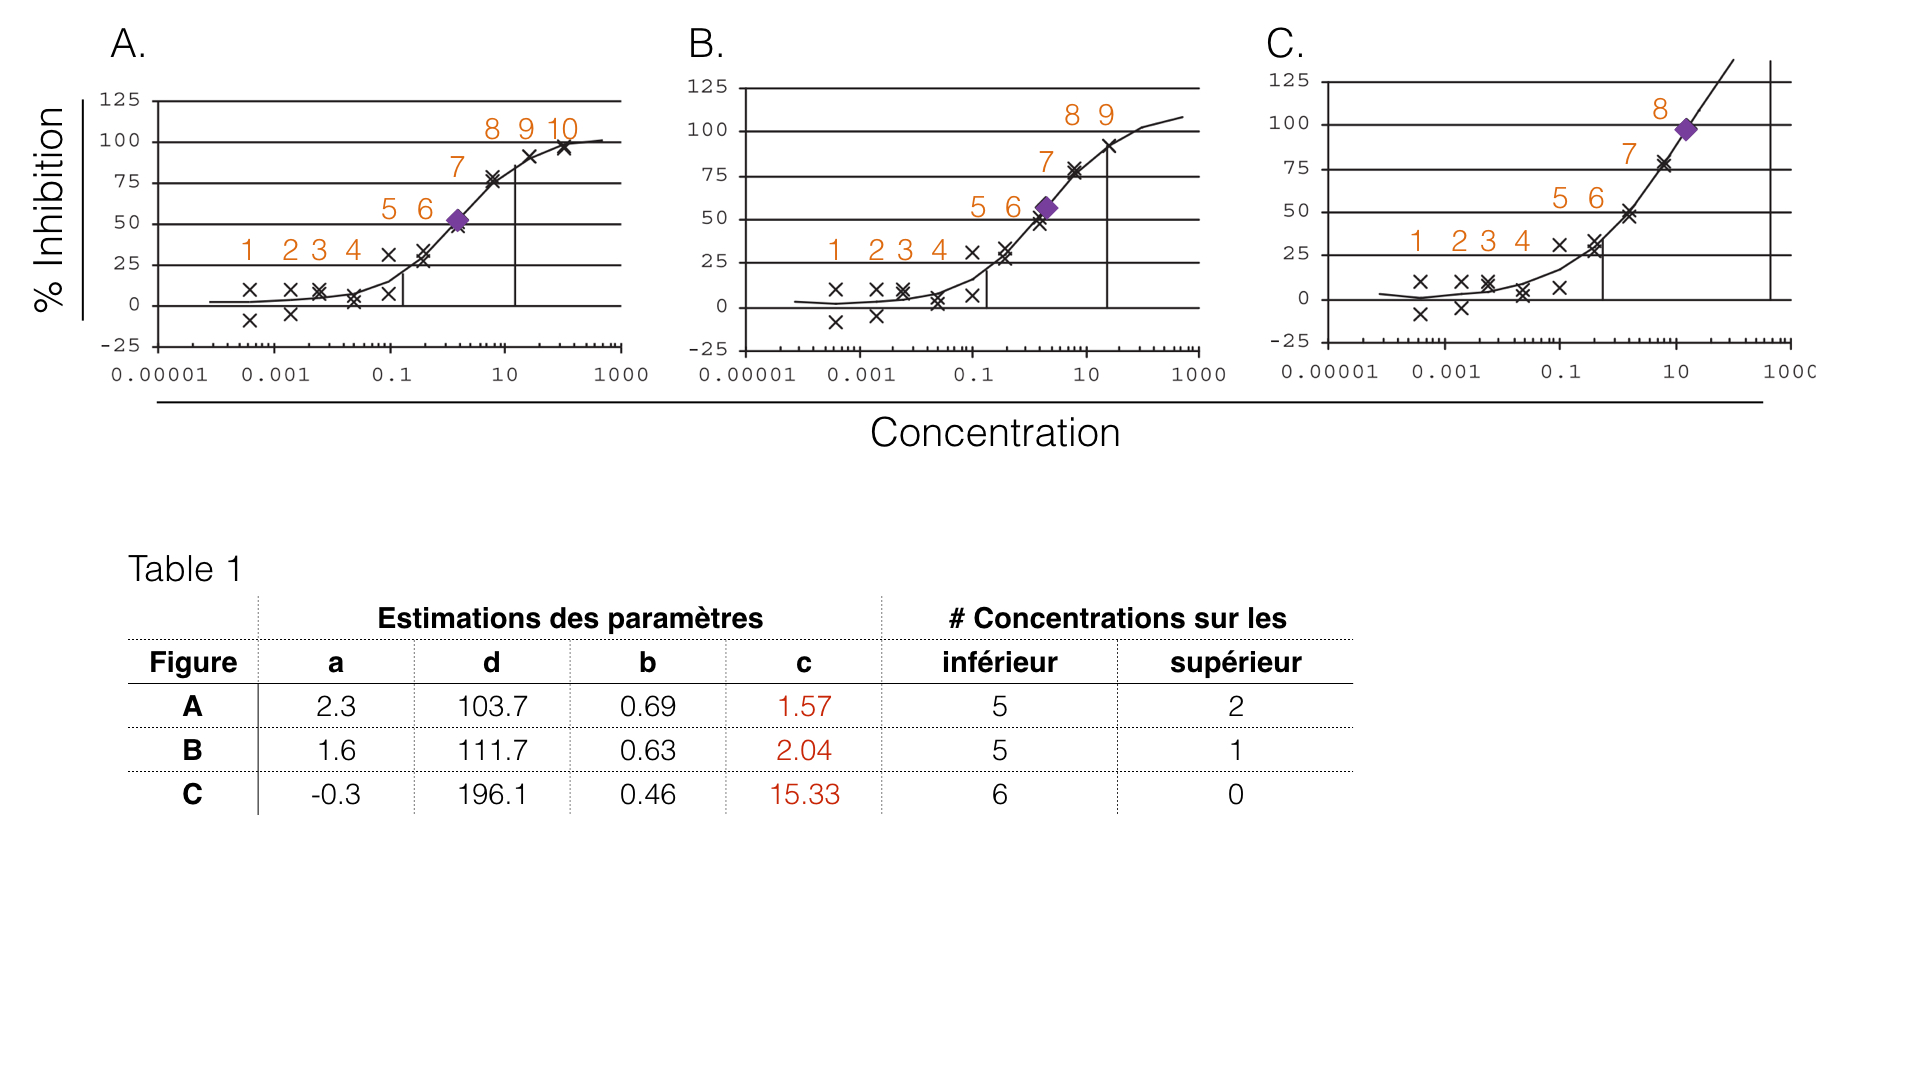
Figure 2. Graphical representation of the effects of the number of concentration(s) on the upper plateau. Plateaus are defined by inflection points (vertical lines) as described by Sebaugh et McCray. A. The lower plateau contains 5 concentrations, the upper 2 concentrations and the relative IC50/EC50 is estimated to be 1.57. B. The lower plateau contains 5 concentrations, the upper 1 concentration and the relative IC50/EC50 is estimated to be 2.04. C. The lower plateau contains 6 concentrations, the upper 0 concentration and the relative IC50/EC50 is estimated to be 15.33.(Adapted from Sebaugh)
Extrems fixed or adjusted?
From a purely biological point of view, it is justifiable to fix the values of the minimum and maximum responses before the optimization process: it is true that at concentration 0 the compound should have no effect on the cells. It is also true that at an infinite concentration, no cell should survive. That being said, in the latter case, is it correct to assume that the absence of cells is truly a cause of the effect of the compound? Could it be that, at an infinite concentration, there are other factors affecting the survival of cells (a lack of nutrients, for example)?
I always find it interesting to start my analysis bu adjusting a log-logistic model with 4 parameters, ie by not fixing the minimum and maximum responses. The estimation of extremes can then highlights some aspects os the analysis. For example, an important negative minimum might indicate that there is an error with the data normalization process, or that there is a problem with the negative controls. Generally, when the minimum estimate is around 0, we are on the right path. Now, the evaluation of the maximum is not always as obvious: an experimental maximum that does not reach 100% is not necessarily bad.
That being said, I continue my analysis by adjusting a second curve with fixed extremes, and a third one for which only the minimum is constant. Comparing the values of the different parameters helps to gain a better understanding of what the “true” values ressemble. It is also interesting to look at the effects of these fixed parameters on the IC50/EC50.
The most important, in my opinion, is to find a balance between what is biologically realistic and what is mathematically valid.
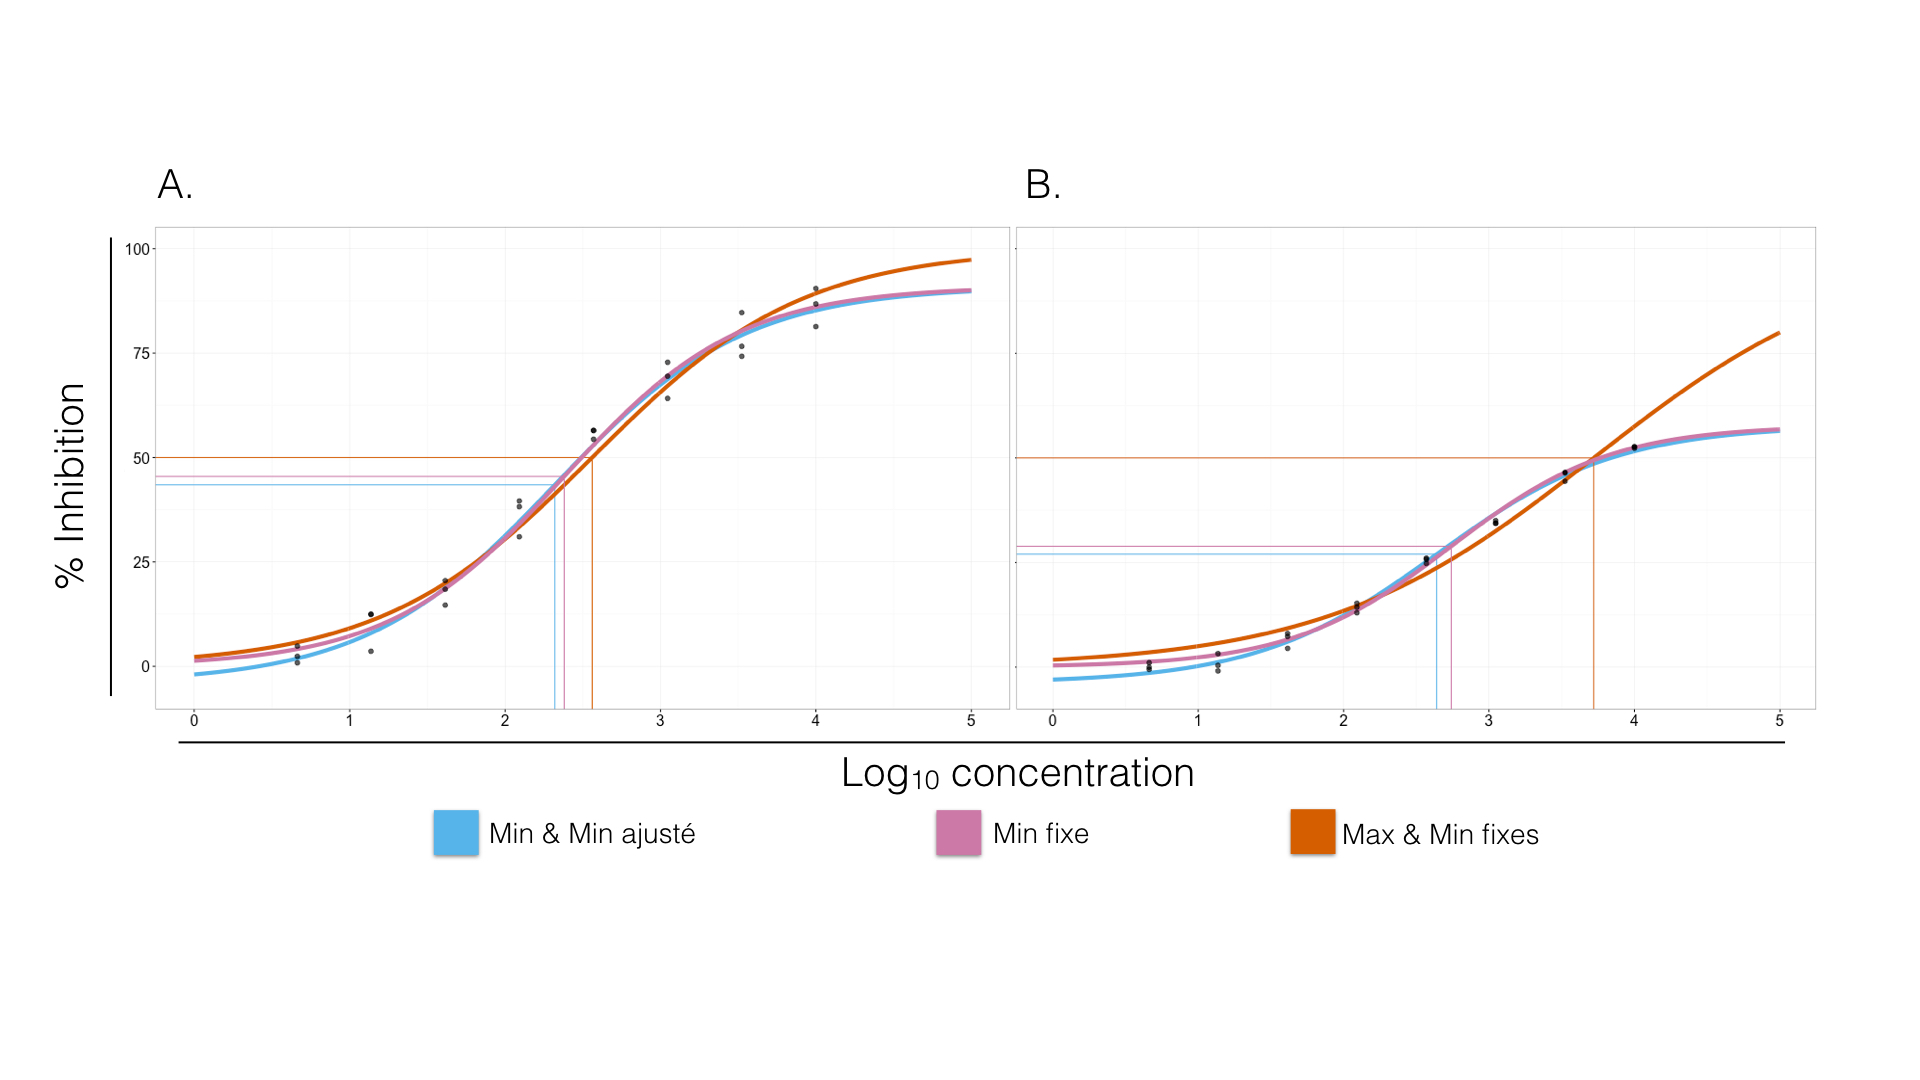
Figure 3. Dose-response curves for two different data sets (A and B). Blue curves have no fixed parameters when adjusting the log-logistic model. Pink curves have a fixed minimal response (parameter $a$) of 0.00%. Orange curves have fixed minimal and maximal responses at 0.00% and 100.00%, respectively. The IC50/EC50 of each curve are represented by the jonction on the horizontal and vertical lines of the same color. A. Bleu: $a = -4.07$, $d = 91.02$, $c = 2.30$ and $b = -0.75$. Pink: $a = 0.00$, $d = 90.90$, $c = 2.37$ and $b = -0.78$. Orange: $a = 0.00$, $d = 100.00$, $c = 2.47$ and $b = -0.65$. The parameters are substantially the same. B. Bleu: $a = -3.27$, $d = 58.08$, $c = 2.70$ and $b = -0.71$. Pink: $a = 0.00$, $d = 57.79$, $c = 2.75$ and $b = -0.81$. Orange: $a = 0.00$, $d = 100.00$, $c = 3.75$ and $b = -0.48$. The parameters estimated when $a$ and $d$ are fixed diverge from those of the other two curves.
Decisions made with respect to evaluating the effectiveness of a compound are largely related to the experimental protocol used for the screen. For example, adding positive controls allows the calculation of the absoluteIC50/EC50 rather then calculation of the relative IC50/EC50. It is important to always review and make sure that the methodology used to analyse the effectiveness was the best suited to our experiment. It is also interesting to note that several publications deal with new approaches specific to certain experiment protocols. In particular, Hafner et al. propose new metrics that account for cell growth in experiments with long incubation periods. Finally, it is useful to have an idea of how we want to analyze the effectiveness before starting the actual experiment since the experimental protocol might require some modifications.
Leave A Comment