

** Special collaboration from the proteomic platform**
Following your sample’s analysis by mass spectrometry, you will usually receive your results as a list of proteins. During the treatment of the data, some factors inevitably influence the proteins found in the final list.
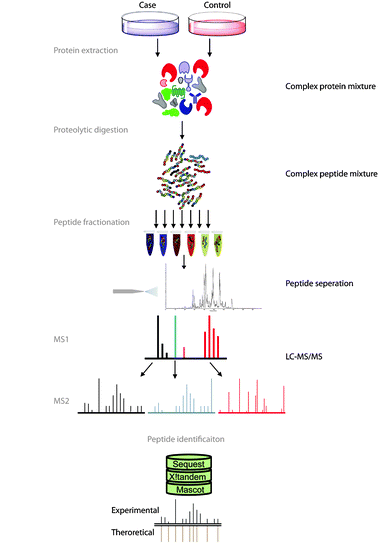
Fig. 1 Overview of bottom-up proteomics. Figure modified from Angel et al. (2011)
Let’s begin by briefly explaining how this protein list is generated by the bottom-up approach usually used (see Figure 1). In this approach, the protein extract is first digested with a protease (usually with trypsin) to create a mix of peptides which is then injected on the liquid chromatography system coupled to the mass spectrometer. The instrument will then acquire a few thousands of fragmentation mass spectrum. Those are used to identify the peptides which are in turn used to infer the protein list.
An efficient approach to associate a peptide sequence to a mass spectrum involves querying a protein database to match the observed masses. The choice of this database is therefore crucial to identify the proteins found in the sample. If a protein is missing in the database, it can obviously not be identified.
Here are some important criteria to consider when choosing the database :
- The database must contains the information for the organism your sample is derived from.
- Ask yourself if the database needs to contain the isoforms, putatives proteins, mutated or synthetic sequences.
- Lastly, check that the sequence identifiers present in the database allow the retrieval of annotations from other sources of data. This is important for the subsequent bioinformatic analysis.
Once the research is completed with the chosen database, the search engine will return a list of peptides. For each pair spectrum-peptide, a score indicates if the fragmentation pattern found in the spectrum matches the peptide sequence.
The use of a dummy database in the searching step allow the estimation of the false positive rate for a certain score threshold. The identified protein list ultimate size is hence dependent on our tolerance for false positives.
When all the spectrum have been treated and the peptide list generated, it’s time to infer the protein list. To illustrate this problem, let’s say that we try to complete simultaneously several puzzles where some pieces are missing and some are identical between the puzzles.
According to the peptide evidence, it is either possible to confirm the presence of a protein (unique peptides) or the presence of a group of proteins (common peptides). Ockham’s razor principle (or parsimony principle) is used to construct a minimal list of proteins. Using this principle, the algorithm assigns iteratively the biggest remaining peptide subset to a protein. One problem of this approach is that it frequently happens that putative or poorly annotated proteins (that’s why choosing a good database is important) get selected. It also happens often that our protein of interest is not in the list generated by Ockham’s principle even if several common peptides are identified. In this case, it is necessary to check if the protein is present in the complete list of possible proteins. To adjust the level of confidence in the final list, two filters are commonly applied. A protein will be in the final list if at least x peptides were identified (in practice, x = 3). We can also filter the protein score which is a combination of the number of peptides and their respective score.
Finally, when you interpret the resulting protein list, check the following points to estimate the level of confidence that you can have in your protein :
- What is the false positive rate for all identified peptides?
- For a protein of interest, check that some unique peptides for this protein are found within all identified peptides and that they have a good score.
- In the case of an identified isoform, check that there is a unique peptide covering a specific exon.
- Check that the protein listed is not only a group representative of protein sequences
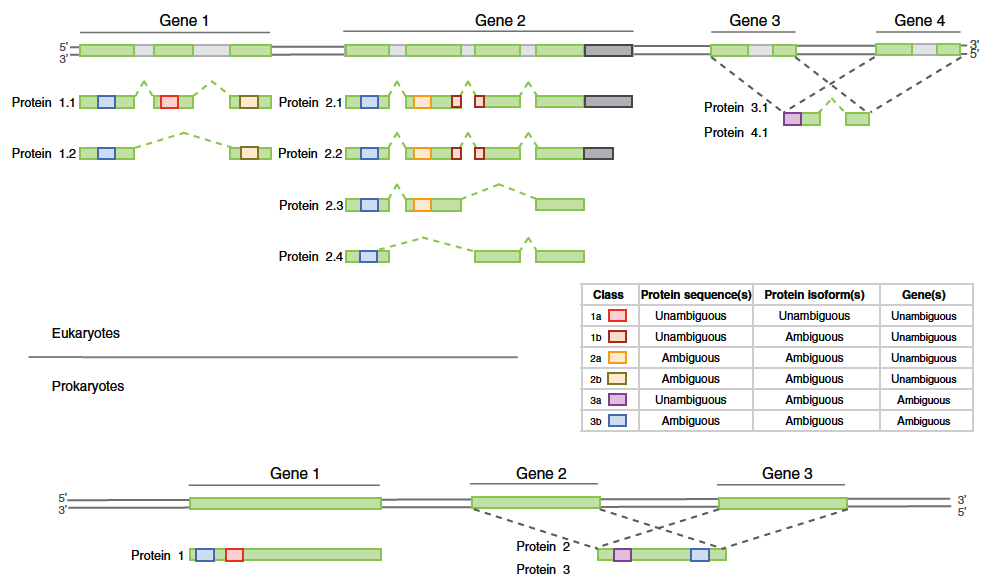
Fig. 2: Overview of the distinct peptide evidence classes for a classification scheme for eukaryotes and prokaryotes. Taken from Queli et al.(2010)
In short, it is important to remember that the bottom-up proteomic approach doesn’t allow an absolute identification of all proteins since we do not have all the puzzle pieces and some are shared.
Leave A Comment