

Updated 27/08/2018
I have already briefly introduced pandas, a Python library, by comparing some of its functions to their equivalents in R. Pandas is a library that makes Python almost as convenient as R when doing data visualization and exploration from matrices and data frames (it is built on top of numpy). It has evolved a lot these past few years as has its community of users. Although pandas is being integrated in a number of specialized packages, such as rdkit for chemoinformatics, R might still offer more specialized statistical packages.
Both languages are great and capable of accomplishing the same tasks. In both cases, libraries or packages are available and provide more “functionalities”. For example, loading two text files containing each 176241 rows and respectively 151 and 574 columns takes significantly less time in Python, about 1-2 minute(s) versus 19 minutes in R using the base function read.delim. However, as pointed out by a reader (see the comments section), some packages allow us to load data into R much faster, in 30 seconds or so in this specific case, making both languages good options to deal with larger datasets.
Below I revisit the “translation” exercise between R and pandas/Python.
Excerpts of a real-life example
My goal is to compare TCGA and Leucegene samples gene expression profiles (all samples were processed using the same pipeline). The expression levels are tpm derived from kallisto when using the GRCh38.84 annotations. The input files contain transcript-level expression identified by Ensembl ID. I did the comparison both in R and Python using Jupyter Notebooks (I was testing the R kernel). For simplicity, I’ve chosen snippets of code from the complete analysis.
1. Reading the input files
R :
tcga <- read.delim('TCGA_LAML_kallisto.txt', header=TRUE)
leuc <- read.delim('Leucegene_GRCh38.84.txt', header=TRUE)
library(data.table)
tcga <- fread('TCGA_LAML_kallisto.txt', header=TRUE)
leuc <- fread('Leucegene_GRCh38.84.txt', header=TRUE) Python :
tcga = pandas.read_csv('TCGA_LAML_kallisto.txt', sep='\t', index_col=0,low_memory=False)
leuc = pandas.read_csv('Leucegene_GRCh38.84.txt', sep='\t', index_col=0,low_memory=False)
2. Defining a function
The function head2 will return the first n row(s) and first n column(s).
R :
# Note that in R, the first index starts at 1.
head2 <- function(mx, n=3) { return (mx[1:n, 1:n]) }
Python :
# Note that in python, the indentation is important.
# Note that in python, the first index starts at 0.
def head2 (mx, n=3) :
    return mx.iloc[0:n,0:n]
3. Checking the dimensions of a dataset
R :
print(dim(tcga))
print(dim(leuc))
Python :
print tcga.shape
print leuc.shape
4. Reformating the columns names
The column names were generated by the pipeline and contained the path of the processed files. For the Leucegene dataset, column names look like /data/DSP001/02H053/transcriptome/kallisto/GRCh38.84/abundance.tsv. It’s not trivial to work with these. To modify them, we need to use string methods.
R :
# The function colnames() is used to get the columns of a matrix of a dataframe
# In R, the slashes are replaced by '.' and an 'X' is added at the beginning of the name
# when the name does not start with a letter
# First we replace the common part in each column names

colnames(leuc) <- gsub('X.data.', '', colnames(leuc))
colnames(leuc) <- gsub('transcriptome.kallisto.GRCh38.84.abundance.tsv', '', colnames(leuc))

# The DSP001/02H000 will change between samples, we want to retrieve only the sample id
# which is 02H000, DSP001 being the id of the project
# To do so, we need to split the remaining string "DSP001.02H000" and return the second
# part which will become the new column name.
colnames(leuc) <-  apply(as.matrix(colnames(leuc)), c(1,2), function(x) {return(strsplit(x, split='\\.')[[1]][2])})
Python :
# The accessor df.columns is used to get the columns of a dataframe

# In Python, we can use list comprehension instead of a for loop which is faster
# For example, [x+1 for [1,2,3,4]] will add 1 to all the values found in the given list
# We replace the common parts of the name, then split the remaining string on '/'
# and return the second element
leuc.columns = [x.replace('/u/leucegene/data/', '').replace('/transcriptome/kallisto/GRCh38.84/abundance.tsv', '')\
.split('/')[1] for x in leuc.columns]
5. Making a graph
R :
library(ggplot2)
mx <-  as.data.frame(t(tcga[105,1:10]))
mx[,1] <- as.numeric(as.vector(mx[,1]))
mx$Samples <- as.factor(rownames(mx))
ggplot(mx, aes(x=Samples, y=`ENST00000631835.1`))+geom_point()+theme(axis.text.x = element_text(angle = 90))
Python :
## There's a ggplot2 package for Python too
## but we the matplotlib functions integrated in pandas
## We use ggplot's style though.
import matplotlib
matplotlib.style.use('ggplot')
tcga.ix[["ENST00000631835.1"], 0:10].astype('float').T.plot(marker='o', rot=90)
Here are the generated graphs :
| R/ggplot2 | Python/Pandas |
|---|---|
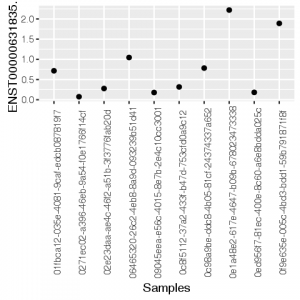 |
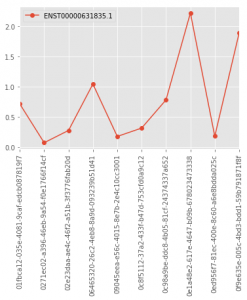 |
Choosing a language is directly related to the task that needs to be accomplished and, in the end, to your personal preferences. However, knowing more than one language gives you more flexibility.
Major comment on: “significantly less time in Python, about 1-2 minute(s) versus 19 minutes in R.”
Please check out data.table (fread) for reading tables in R.
It is orders of magnitude faster than data.frame (read.delim).
Should be extremely fast to load the files mentioned.